

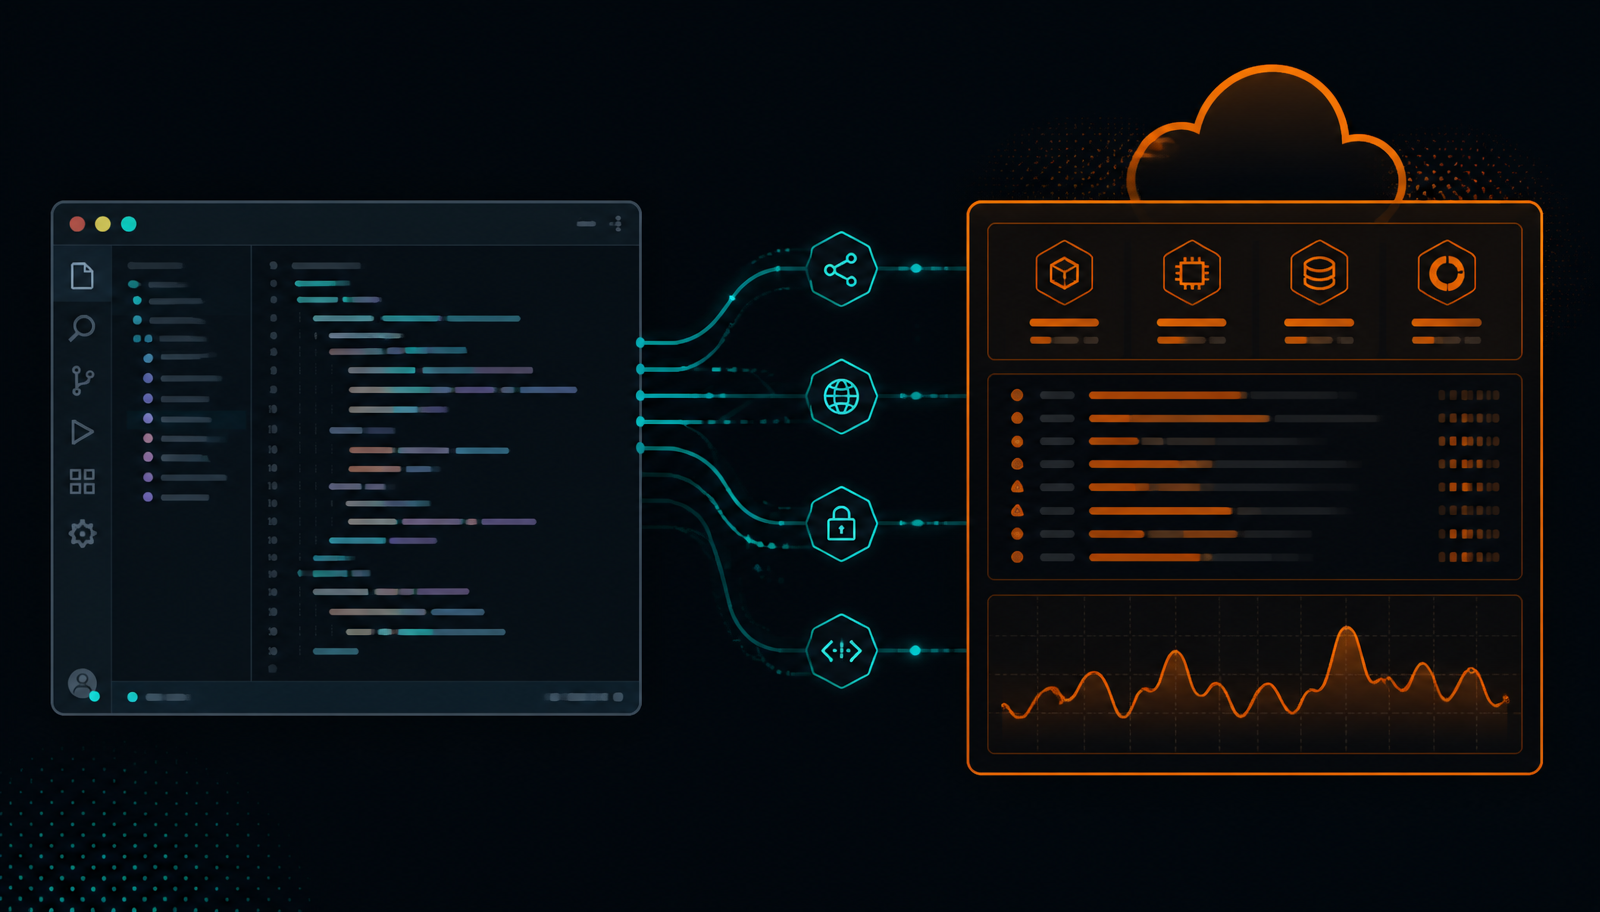
Debugging a production issue usually costs me three context switches: the editor where the code lives, a browser tab for the AWS console, and a second browser tab for whatever other repository owns the service that actually broke. Every one of those switches drops a little bit of the mental model I was holding.
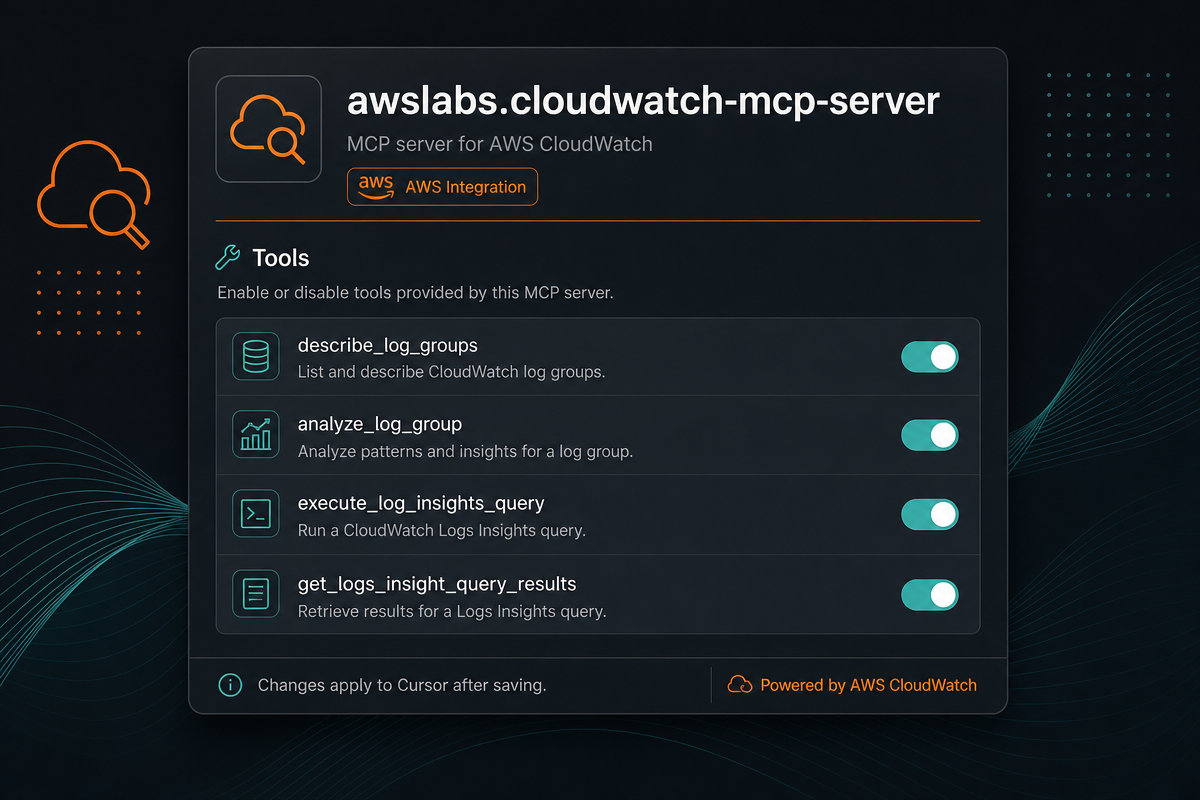
The AWS CloudWatch MCP server removes two of them. Cursor gets a tool that can list log groups, run Logs Insights queries, read metrics and pull active alarms — which means I can ask a question in plain language, in the editor, with the code in context, and get an answer from real production telemetry. No console login, no tab.
The best part is not that the AI can read your logs. It is that it can read your logs *while it is reading your code*.
MCP servers and tools used here
What MCP actually gives you here
The Model Context Protocol is a small standard for exposing tools to an AI client. AWS Labs ships an official CloudWatch MCP server that wraps the CloudWatch APIs into those tools. Cursor launches it as a local subprocess over stdio, discovers its tools, and can then call them mid-conversation.
The important detail: the server runs on your machine, under your AWS credentials. Nothing about your account is uploaded anywhere — the model only sees the results of the calls it asks for, exactly like it sees the file contents it opens.
AWS Labs — CloudWatch MCP Server documentationOfficial docs for the server used throughout this article, including its full tool list.The setup
You need uv (which provides uvx) and an AWS profile configured locally. The server itself is published by AWS Labs on PyPI as awslabs.cloudwatch-mcp-server, so uvx pulls and runs it without you installing anything permanently. Then add the server to Cursor's MCP configuration — either the global ~/.cursor/mcp.json or a per-project .cursor/mcp.json:
1{2 "mcpServers": {3 "awslabs.cloudwatch-mcp-server": {4 "autoApprove": [],5 "disabled": false,6 "command": "/opt/homebrew/bin/uvx",7 "args": [8 "awslabs.cloudwatch-mcp-server@latest"9 ],10 "env": {11 "AWS_PROFILE": "...your-profile...",12 "AWS_REGION": "us-east-1",13 "FASTMCP_LOG_LEVEL": "ERROR"14 },15 "transportType": "stdio"16 }17 }18}- command — the absolute path to uvx. Cursor does not inherit your shell PATH, so
which uvxand paste the result. This is the single most common reason the server shows up red. - args — pinning @latest keeps you current; pin an explicit version if you want reproducibility across a team.
- AWS_PROFILE — the profile the server authenticates with. Point this at a dedicated read-only profile, not your admin one.
- AWS_REGION — the default region for queries. You can still ask for another region per prompt.
- FASTMCP_LOG_LEVEL: ERROR — keeps protocol chatter out of the transport.
- autoApprove: [] — leave it empty. Every tool call gets confirmed by you the first time. Auto-approving read-only tools later is reasonable; auto-approving everything on day one is not.
Restart Cursor, open Settings → MCP, and the server should report as connected with its tool list populated. If it does not, run the command manually in a terminal — uvx awslabs.cloudwatch-mcp-server@latest — and read the error it prints.
The minimal IAM role
This is the part people skip, and it is the part that matters. An MCP server is a program that will happily call any API your credentials permit, driven by a model that is interpreting natural language. Your IAM policy is the guardrail — not the model's good judgment, not the autoApprove list.
For reading logs, metrics and alarms, this is genuinely everything you need:
1{2 "Version": "2012-10-17",3 "Statement": [4 {5 "Sid": "CloudWatchLogsRead",6 "Effect": "Allow",7 "Action": [8 "logs:DescribeLogGroups",9 "logs:DescribeLogStreams",10 "logs:GetLogEvents",11 "logs:FilterLogEvents",12 "logs:StartQuery",13 "logs:GetQueryResults",14 "logs:StopQuery",15 "logs:DescribeQueryDefinitions",16 "logs:GetLogGroupFields",17 "logs:DescribeMetricFilters"18 ],19 "Resource": "*"20 },21 {22 "Sid": "CloudWatchMetricsAndAlarmsRead",23 "Effect": "Allow",24 "Action": [25 "cloudwatch:GetMetricData",26 "cloudwatch:GetMetricStatistics",27 "cloudwatch:ListMetrics",28 "cloudwatch:DescribeAlarms",29 "cloudwatch:DescribeAlarmHistory"30 ],31 "Resource": "*"32 },33 {34 "Sid": "DenyEverythingMutating",35 "Effect": "Deny",36 "Action": [37 "logs:Delete*",38 "logs:Put*",39 "cloudwatch:Put*",40 "cloudwatch:Delete*",41 "cloudwatch:SetAlarmState",42 "iam:*",43 "sts:AssumeRole"44 ],45 "Resource": "*"46 }47 ]48}Two notes on that policy. The read actions need Resource: "*" in practice because Logs Insights queries span log groups and DescribeLogGroups is not resource-scopable in a useful way — if you want to narrow it, scope logs:GetLogEvents and logs:StartQuery to specific log-group ARNs. The explicit Deny block is the belt-and-braces part: even if someone later attaches a broader policy to the same principal, the Deny wins.
You can also pin the role to a single region, which is worth doing if your workloads live in one place:
1"Condition": {2 "StringEquals": { "aws:RequestedRegion": "us-east-1" }3}Short-lived credentials, not access keys
Do not create an IAM user with a long-lived access key for this. An access key sitting in ~/.aws/credentials is a permanent secret on a laptop that also runs an AI agent, a browser and every npm package you ever installed. Use a role you assume, with credentials that expire.
Option 1: IAM Identity Center (the right answer)
If your organization uses IAM Identity Center, the profile is entirely keyless. Credentials come from an SSO session and expire on their own:
1# ~/.aws/config2[profile cw-readonly]3sso_session = my-org4sso_account_id = 1111222233335sso_role_name = CloudWatchReadOnly6region = us-east-17 8[sso-session my-org]9sso_start_url = https://my-org.awsapps.com/start10sso_region = us-east-111sso_registration_scopes = sso:account:accessThen aws sso login --profile cw-readonly once per day, and set AWS_PROFILE=cw-readonly in the MCP config. When the session expires, the tools stop working until you log in again — which is exactly the behavior you want.
Option 2: a programmatic role you assume
Without Identity Center, create a role (say CloudWatchReadOnlyMCP) that carries the policy above, and have your local profile assume it with a short session:
1# ~/.aws/config2[profile cw-readonly]3role_arn = arn:aws:iam::111122223333:role/CloudWatchReadOnlyMCP4source_profile = base5duration_seconds = 36006region = us-east-17mfa_serial = arn:aws:iam::111122223333:mfa/example-userThe trust policy on the role should name the exact principal allowed to assume it, require MFA, and cap the session length:
1{2 "Version": "2012-10-17",3 "Statement": [4 {5 "Effect": "Allow",6 "Principal": { "AWS": "arn:aws:iam::111122223333:user/example-user" },7 "Action": "sts:AssumeRole",8 "Condition": {9 "Bool": { "aws:MultiFactorAuthPresent": "true" },10 "NumericLessThan": { "aws:MultiFactorAuthAge": "3600" }11 }12 }13 ]14}Set MaxSessionDuration on the role to one hour. The SDK inside the MCP server refreshes automatically while the source session is valid, and everything goes dark when it is not. The worst case for a leaked credential becomes “someone could read logs for the remainder of an hour,” which is a completely different incident than “someone has a permanent read key.”
| Approach | Lifetime | Blast radius if leaked |
|---|---|---|
| IAM user access key | Until manually rotated | Permanent read access, often unnoticed |
| Assumed role + MFA | 1 hour | Read-only, expires on its own |
| Identity Center session | Session length (often 8h, revocable centrally) | Read-only, revocable by an admin instantly |
The cross-repository part
Here is where this stops being a convenience and starts being a genuinely different way to work. Production incidents almost never live in one repository. The symptom appears in the mobile app, the error is thrown by an API service, and the root cause is a Lambda in a third repo that nobody has opened in four months.
The MCP server does not care about repository boundaries — it is scoped to your AWS account, not to your workspace. So the model can hold the code of the repo you are in *and* the telemetry of every service in the account at the same time. You ask about a failing checkout, and it can correlate the API log group, the Lambda log group and the alarm history without you telling it which repo each one belongs to.
In practice, this means the workflow inverts. Instead of finding an error in the console and then hunting for the code that produced it, you point at the code and ask what production is doing with it. That is a much shorter path, and it keeps you in one window the whole time.
Example prompts
The tools are only as useful as the questions. These are the ones that earn their keep for me — all of them read-only, all of them answered without opening a browser.
Triage
- “Which CloudWatch alarms are in ALARM right now, and how long have they been there?”
- “List the log groups with the highest error volume in the last hour.”
- “Show me every ERROR-level log entry across /aws/lambda/* in the last 30 minutes, grouped by function.”
- “What changed? Compare error rates for the checkout API over the last 2 hours against the same window yesterday.”
Root cause, with the code open
- “This handler I have open throws OrderValidationError. Find the last 20 occurrences in CloudWatch and tell me what the failing inputs have in common.”
- “Run a Logs Insights query on /aws/lambda/checkout-processor for the last 6 hours, extract the requestId of every timeout, and then show me the corresponding API Gateway log lines.”
- “Correlate the p99 latency spike on the payments service at 14:20 UTC with anything in the log groups of its downstream dependencies.”
- “The function in this file was deployed at 09:00. Did its error rate or duration change after that?”
Cross-repository correlation
- “Trace request ID 7f3a…9c through every log group in the account and give me the timeline in order.”
- “The mobile client reports 502s on /v1/orders. Which service in the account is actually producing the 5xx, and what is the exception?”
- “List every Lambda in this account that logged a throttling error today, and tell me which downstream service each one was calling.”
Turning the answer into work
- “Based on those log entries, write the failing test case for the handler in this file.”
- “Summarize this incident from the logs as a timeline I can paste into a postmortem doc.”
- “Given this error pattern, what log fields are we missing? Patch the logger in this repo to emit them.”
That last group is the real payoff. The model reads production, then edits the code that produced it, in one continuous conversation. There is no copy-paste step between the two.
A few honest caveats
- Logs Insights queries cost money per GB scanned. A vague prompt over a 30-day window on a busy log group is a real bill. Tell it the time range.
- Log lines can contain PII or secrets. The model sees whatever the query returns — so treat the account you connect the same way you would treat any log export.
- Keep autoApprove empty until you trust the query shapes it generates, then approve only the read tools.
- Give it one read-only account. “I will just point it at my admin profile for now” is how this goes wrong.
Why I like this so much
Most AI tooling makes writing code faster. This one makes *understanding a running system* faster, which is the part of the job that actually takes the time.
With MCP wired up, the translation step disappears. You ask the question you already had in your head, the tools go and get the data, and you stay in the file you were reading. Fifteen minutes of console archaeology becomes one sentence — and you never lose the thread you were pulling on.
Give it a read-only role, an hour-long session, and a specific question. Then never open the console for triage again.
Links and further reading
Everything referenced above, in one place — the AWS Labs server itself, the protocol it speaks, and the two pieces of tooling you need locally.
AWS CloudWatch MCP Server — official documentationTool reference, configuration options and required IAM actions, maintained by AWS Labs.awslabs/mcp — cloudwatch-mcp-server sourceThe source for the server, inside the AWS Labs MCP monorepo. Worth reading before you grant it credentials.AWS Labs MCP servers — the full collectionCloudWatch is one of many: there are official servers for Cost Explorer, DynamoDB, Lambda, ECS, documentation search and more.awslabs.cloudwatch-mcp-server on PyPIThe package uvx resolves when you pin @latest — use it to pick an explicit version for a team setup.Model Context Protocol — specificationThe open standard behind all of this, if you want to write a server of your own.Cursor — MCP configuration docsWhere mcp.json lives, how servers are discovered, and how tool approval works in the editor.uv — installation guideInstalls the uvx runner that the command field in the config points at.AWS IAM Identity Center — user guideThe keyless, short-lived-credential option from the security section above.